Self-service kiosks are no longer optional for retail chains — they are a competitive requirement. But does the math actually work? This data-driven ROI analysis breaks down the real costs, labor savings, revenue uplift, and payback period for kiosk deployment across QSR, retail, and multi-store environments. Includes a step-by-step calculation model, deployment roadmap, and common mistakes to avoid.
12–18 months
Typical payback period for a retail chain kiosk deployment
15–30%
Average ticket increase
25–40%
Peak throughput gain
20–40%
Labor cost reduction
$3B–$6B
Kiosk market segment
Table of Contents
- The Self-Service Kiosk Market in 2026
- The Three Measurable ROI Drivers
- Labor Savings: The Real Number
- Average Ticket Lift: How Kiosks Sell More
- Throughput Gains: Serving More Customers Per Hour
- Total Cost of Kiosk Deployment
- ROI Calculation: Step-by-Step Model
- ROI by Business Type: QSR, Retail, Supermarket
- Chain-Wide Deployment Roadmap
- Common Kiosk Deployment Mistakes
- Hardware Requirements for Kiosk Deployments
- Frequently Asked Questions
1. The Self-Service Kiosk Market in 2026
The self-service kiosk market has reached a tipping point. According to KioskIndustry.org, the global installed base of self-service kiosks is estimated at 8–15 million units as of 2025, with the broader self-service technology ecosystem exceeding $150 billion globally. The restaurant self-order kiosk segment alone is valued at $3–6 billion, growing at 15–20% CAGR.
Major chains are driving this growth. McDonald's has deployed kiosks across 20,000+ locations. Retailers like Walmart and Target have expanded self-checkout to all U.S. stores. The question for retail chain operators is no longer "should we deploy kiosks?" — it is "how do we maximize the ROI?"
Market Data (2026): 60% of consumers prefer self-service options when available. Kiosk deployments increase average order values by 15–30% through upsell automation. Ordering time is reduced by 20–40%. Cashless transactions now account for 70%+ of kiosk payments. (Source: KioskIndustry.org, National Restaurant Association)
2. The Three Measurable ROI Drivers
Self-service kiosk ROI is driven by three quantifiable factors. Every ROI calculation should account for all three:
| ROI Driver | Mechanism | Typical Impact |
|---|---|---|
| Average Ticket Lift | Kiosks present upsell prompts, combo suggestions, and visual menu items at every step — more systematically than human cashiers | 15–30% increase in average order value |
| Labor Cost Reduction | Kiosks handle ordering/payment transactions that previously required cashier staff. Staff is redeployed, not necessarily eliminated | 20–40% reduction in front-of-house labor cost |
| Throughput Gain | Parallelized ordering — 4 kiosks serve more customers per minute than 2 cashier lanes. Reduces walk-aways during peak hours | 25–40% increase in peak-hour throughput |
Most ROI analyses only account for one or two of these drivers — typically labor savings alone. This significantly understates the true return. A complete model includes all three.
3. Labor Savings: The Real Number
Labor savings is the most cited — and most misunderstood — kiosk ROI factor. Let us break down the real math.
The Misconception: "Kiosks Replace Cashiers"
The most common oversimplification is: "Each kiosk replaces one cashier, so we save one salary per kiosk." This is rarely how deployment works in practice. Most operators do not fire cashiers — they redeploy them to roles that improve guest experience: food runners, expediters, hosts, and floor support.
The Real Labor Model
Here is how labor savings actually works in a typical deployment:
| Scenario | Before Kiosks | After Kiosks (4 units) | Monthly Savings |
|---|---|---|---|
| Front counter cashiers | 4 FTE @ $15/hr | 2 FTE (1 cashier + 1 floater) | $5,200 |
| Floor/runner staff (redeployed) | 2 FTE | 3 FTE (redeployed from counter) | $0 (net neutral) |
| Kiosk maintenance (new) | 0 | 0.2 FTE shared across store | -$520 |
| Net Monthly Labor Savings | $4,680 | ||
Assumptions: 4 kiosks replace 2 cashier positions; redeployed staff maintain headcount; kiosk maintenance is 8 hours/week at $15/hr. Monthly = 4.33 weeks.
Key Insight: Labor cost reduction is typically 20–40% of front-of-house labor — not 100%. The value of that labor increases because redeployed staff improve throughput, order accuracy, and customer experience. Factor this into your ROI model.
4. Average Ticket Lift: How Kiosks Sell More
The single highest-impact ROI driver is often the least expected: kiosks consistently increase average order value. Studies across QSR deployments show 15–30% ticket lift, with the biggest gains on modifier-heavy menus.
Why Kiosks Sell More
- Systematic upsell prompts: Every order triggers "Would you like to add fries?" "Add a drink for $1.50?" — a human cashier forgets or feels awkward asking; a kiosk never does
- Visual menu presentation: High-quality images of menu items and add-ons increase purchase desire. Customers see what they are ordering, not just reading text
- No social pressure: Customers feel comfortable customizing extensively ("extra pickles, no onion, add bacon") without feeling they are slowing down a cashier
- Combo optimization: Kiosks automatically suggest the best-value combo, which often has a higher ticket than the items the customer initially planned to order
- Dessert and beverage prompts: Post-entree prompts add high-margin items that cashiers rarely suggest
Ticket Lift by Business Type
| Business Type | Typical Ticket Lift | Primary Driver |
|---|---|---|
| QSR / Fast Food | 15–30% | Combo upsell, dessert/beverage prompts |
| Fast Casual / Build-Your-Own | 20–30% | Modifier prompts (extra toppings, premium ingredients) |
| Café / Bubble Tea | 18–25% | Add-on prompts (pastry with coffee, size upgrade) |
| Retail Self-Checkout | 5–15% | Less impulse-buy lift; primarily throughput-driven |
| Supermarket | 5–10% | Primarily labor savings, not ticket lift |
Important: Ticket lift only materializes if your kiosk software is configured with well-designed upsell prompts. A kiosk with no upsell configuration will show minimal ticket increase. Work with your POS software vendor to design the prompt flow — this is where the ROI lives.
5. Throughput Gains: Serving More Customers Per Hour
Throughput improvement is the ROI factor most often omitted from calculations — yet it can represent the largest financial impact for high-volume locations.
The Walk-Away Problem
During peak hours, long queues cause customers to leave without ordering. Industry data suggests that 5–15% of potential customers walk away from a QSR when the queue exceeds 6–8 people. For a store doing 200 transactions/day at $14 average ticket, losing even 10 customers per day during peak hours costs $1,400/day — or $42,000/month in lost revenue.
How Kiosks Improve Throughput
- Parallel ordering: 4 kiosks serve 4 customers simultaneously, vs. 1 customer per cashier lane. Even if each kiosk transaction takes longer (due to browsing and customization), the aggregate throughput is higher
- Reduced wait perception: Customers are more patient when actively interacting with a kiosk than when standing in a passive queue
- Order accuracy: Kiosks eliminate verbal miscommunication — no "I said no onions" disputes. This reduces re-order and refund costs
- Peak-hour capacity: During lunch and dinner rushes, kiosks add capacity without requiring additional staff scheduling
| Metric | Before Kiosks (2 Cashiers) | After Kiosks (4 Kiosks + 1 Cashier) |
|---|---|---|
| Peak-hour transactions | 120/hour (60 per cashier) | 180/hour (45 per kiosk × 4) |
| Average wait time | 4–8 minutes | 1–3 minutes |
| Walk-away rate | 8–12% | 2–4% |
| Daily recovered revenue | — | $500–$1,500 |
6. Total Cost of Kiosk Deployment
Before calculating ROI, you need a complete picture of all costs — not just the hardware purchase price. Here is the full cost breakdown for a typical deployment:
| Cost Category | Per-Unit Range | For 4-Kiosk Deployment | Notes |
|---|---|---|---|
| Kiosk hardware | $2,000–$5,000 | $8,000–$20,000 | Touchscreen, payment terminal, receipt printer, enclosure |
| Installation & mounting | $500–$1,200 | $2,000–$4,800 | Floor mount, power, network, ADA-compliant placement |
| POS software integration | $500–$2,000 | $2,000–$8,000 | One-time setup: menu sync, payment gateway, upsell config |
| Network infrastructure | $200–$500 | $800–$2,000 | Dedicated network drop, PoE switch if needed |
| Software/Cloud fee (monthly) | $50–$150/kiosk/mo | $200–$600/mo | Cloud POS, kiosk management, analytics dashboard |
| Maintenance (annual) | $200–$500/unit/yr | $800–$2,000/yr | Component replacement, firmware updates, cleaning |
| Total Upfront Investment (4 kiosks) | $12,800–$34,800 | Hardware + install + integration + network | |
| Ongoing Monthly Cost | $267–$767/mo | Software fee + maintenance amortized | |
Costs vary significantly by kiosk form factor (floor-standing vs. counter-mounted), screen size, and integration complexity. Contact SynqNode for a project-specific quotation.
7. ROI Calculation: Step-by-Step Model
Let us calculate the complete ROI for a representative retail chain store. This model uses conservative mid-range assumptions.
Assumptions: Mid-Volume QSR Store
- Daily transactions: 200
- Current average ticket: $14
- Current daily revenue: $2,800 ($84,000/month)
- Deployment: 4 kiosks
- Hours of operation: 12 hours/day, 30 days/month
Step 1: Calculate Revenue Uplift from Ticket Increase
| Metric | Value | Calculation |
|---|---|---|
| Current monthly revenue | $84,000 | 200 tx/day × $14 × 30 days |
| Ticket lift (conservative 15%) | $12,600/mo | $84,000 × 15% |
| Monthly revenue uplift | $12,600 |
Step 2: Calculate Recovered Revenue from Walk-Away Reduction
| Metric | Value | Calculation |
|---|---|---|
| Current walk-away rate (10%) | 22 customers/day | 200 × (10/90) estimated |
| Post-kiosk walk-away rate (3%) | 6 customers/day | Reduced queue wait |
| Recovered customers/day | 16 | 22 - 6 |
| Recovered daily revenue | $224 | 16 × $14 |
| Monthly recovered revenue | $6,720 | $224 × 30 |
Step 3: Calculate Labor Savings
| Metric | Value | Calculation |
|---|---|---|
| Cashier positions reduced | 2 FTE | 4 kiosks replace 2 cashier lanes |
| Hourly wage (loaded) | $18/hr | $15 base + 20% benefits |
| Weekly hours saved | 168 hours | 2 FTE × 84 hrs/week (12 hrs × 7 days) |
| Weekly labor savings | $3,024 | 168 × $18 |
| Kiosk maintenance cost | -$540/mo | 8 hrs/wk × $15 × 4.33 |
| Net monthly labor savings | $12,564 | ($3,024 × 4.33) - $540 |
Step 4: Calculate Total ROI
| ROI Component | Monthly Value |
|---|---|
| Revenue uplift (ticket lift) | $12,600 |
| Recovered revenue (walk-away reduction) | $6,720 |
| Labor savings (net of maintenance) | $12,564 |
| Less: Monthly software + cloud fees | -$400 |
| Total Monthly Net Benefit | $31,484 |
| Total upfront investment (4 kiosks) | $22,000 (mid-range) |
| Payback Period | 0.7 months (~21 days) |
| Annual Net Benefit | $377,808 |
| Annual ROI | 1,718% |
Important Note: The above calculation represents a high-volume QSR with 200+ daily transactions. ROI scales with volume — lower-volume stores will see proportionally smaller returns and longer payback periods. Always model with your store's actual transaction data. The scenario table below shows ROI across different business types.
8. ROI by Business Type: QSR, Retail, Supermarket
ROI varies significantly by business type. Here is a comparison across common kiosk deployment scenarios:
| Metric | QSR / Fast Food | Retail Self-Checkout | Supermarket |
|---|---|---|---|
| Daily transactions | 200 | 150 | 500+ |
| Average ticket | $14 | $35 | $60 |
| Ticket lift | 15–30% | 5–10% | 3–8% |
| Primary ROI driver | Ticket lift + throughput | Labor savings + throughput | Labor savings |
| Kiosks per store | 2–4 | 2–4 | 4–8 |
| Upfront investment | $12K–$35K | $12K–$35K | $24K–$70K |
| Monthly net benefit | $15K–$35K | $5K–$15K | $8K–$25K |
| Payback period | 1–3 months | 2–6 months | 3–9 months |
Realistic Expectations: The payback periods above assume well-configured kiosk software with proper upsell prompts, adequate staff training, and sufficient customer adoption (60%+ of transactions within 3 months). Stores with low transaction volume, poor kiosk placement, or no upsell configuration will see significantly longer payback periods.
9. Chain-Wide Deployment Roadmap
For retail chains, a phased rollout is critical to minimize risk and optimize the deployment model before scaling. Here is the recommended roadmap:
Phase 1: Pilot (Weeks 1–8)
- Select 1–3 pilot stores: Choose stores with different volume levels and customer demographics
- Install 2–4 kiosks per pilot store: Use the kiosk hardware configuration you plan to standardize on
- Configure upsell prompts: Work with your POS software vendor to design the complete upsell flow
- Measure baseline and post-deployment metrics: Track average ticket, daily transactions, walk-away rate, labor hours, and customer feedback
- Train staff: Emphasize that kiosks are a tool to improve their workflow, not a replacement
Phase 2: Optimization (Weeks 9–12)
- Analyze pilot data: Is the ticket lift meeting expectations? Is throughput improving? Are customers adopting kiosks?
- Adjust kiosk placement: Move kiosks to higher-traffic areas if adoption is below 40%
- Refine upsell prompts: A/B test different prompt combinations to maximize ticket lift
- Finalize hardware specification: Lock in the kiosk model, screen size, and peripheral configuration for chain-wide rollout
Phase 3: Chain-Wide Rollout (Months 4–12)
- Standardize deployment kit: Define a standard package: kiosk hardware, mounting, network, software configuration, and installation process
- Roll out in batches: Deploy 5–10 stores per batch, allowing 2–3 weeks between batches for installation and training
- Centralized monitoring: Use a cloud-based kiosk management dashboard to monitor all kiosks across all stores — uptime, error rates, and adoption rates
- Establish maintenance protocol: Define weekly cleaning, monthly inspection, and quarterly firmware update schedules
Phase 4: Optimization and Expansion (Month 12+)
- Add kiosks to high-performing stores: If 4 kiosks are at 80%+ utilization, add more
- Explore new use cases: Order pickup lockers, self-checkout for specific departments, loyalty program integration
- Review ROI annually: Re-run the ROI model with actual data to inform hardware refresh decisions
10. Common Kiosk Deployment Mistakes
Learning from others' mistakes is cheaper than making them yourself. Here are the most common kiosk deployment failures and how to avoid them:
| Mistake | Impact | Solution |
|---|---|---|
| Kiosks placed behind the counter | Customers don't see them; adoption <10% | Place kiosks in the customer flow path — between entrance and counter |
| No clear queue management | Customers confused about where to line up | Use floor decals and stanchions to define kiosk queue vs. cashier queue |
| Slow menu loading | 10–20% of users abandon before completing order | Ensure adequate hardware specs (4GB+ RAM) and optimize POS software for kiosk |
| No upsell configuration | Ticket lift <5% — ROI barely covers costs | Design prompt flow with your POS vendor — this is where the ROI lives |
| Removing all cashier lanes | Accessibility complaints; older customers alienated | Always keep at least 1 cashier-staffed lane for accessibility and preference |
| Underestimating installation costs | Budget overrun of $500–$1,200 per kiosk | Include mounting, power, network, and ADA compliance in upfront budget |
| No maintenance plan | Kiosk downtime during peak hours; revenue loss | Define weekly cleaning, monthly inspection, and spare-part inventory |
| Insufficient hardware specs | UI lag during peak; peripheral disconnections | Minimum: 4GB RAM, capacitive touch, fanless design, 4G failover |
| No offline mode | Entire kiosk bank goes down when internet drops | Ensure POS software supports offline ordering and local cache |
| Ignoring ADA compliance | Legal risk; customer complaints | Mount at accessible height (15–48 inches); audio jack for screen reader |
11. Hardware Requirements for Kiosk Deployments
For system integrators and chain IT teams specifying kiosk hardware, here are the requirements that matter for ROI-positive deployments:
| Component | Specification | Why It Matters for ROI |
|---|---|---|
| Touch screen | 21.5"–32" portrait, capacitive, 400+ nits | Larger screens show full menu without scrolling — faster ordering |
| Industrial PC / Mini PC | 4-core CPU, 4–8 GB RAM, fanless | Fanless = no dust intake failures; adequate RAM = no UI lag |
| Payment terminal | NFC + EMV + QR scanner, PCI-PTS certified | Fast payment = higher throughput; certification = no liability risk |
| Receipt printer | 80mm thermal, auto-cutter, high-capacity rolls | Auto-cutter prevents paper jams; large rolls reduce refill frequency |
| OS | Windows IoT (kiosk mode) or Android (kiosk mode) | Lockdown prevents tampering; single-app mode = dedicated ordering terminal |
| Connectivity | Ethernet primary + 4G failover | Network redundancy = no downtime during ISP outages |
| Enclosure | Tamper-resistant, lockable service panel, ADA height | Physical security + regulatory compliance |
| Camera (optional) | HD camera for analytics or barcode scanning | People counting, heat maps, QR code scanning for loyalty |
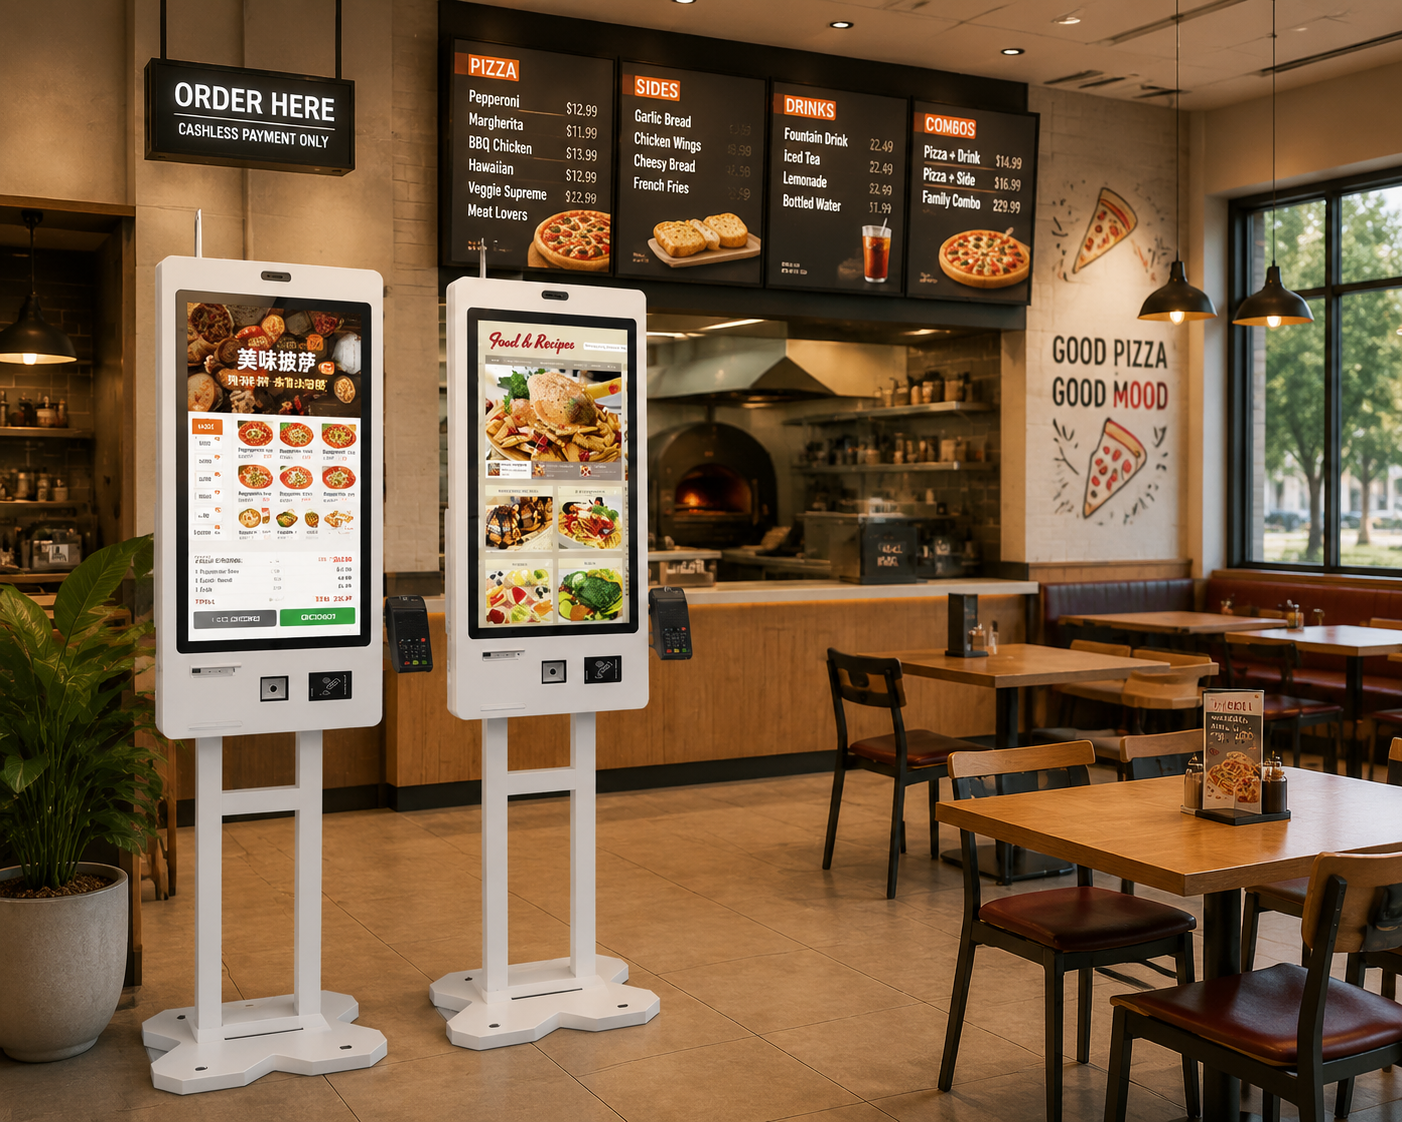
Explore SynqNode Self-Service Kiosks for configurable kiosk hardware engineered for 24/7 commercial operation. Our kiosks support Windows, Android, and Linux — with open SDKs for POS software integration and OEM/ODM customization for chain-wide branding.
Planning a Kiosk Deployment for Your Chain?
SynqNode manufactures self-service kiosks with integrated payment, printing, and scanning — engineered for 24/7 commercial operation. We support OEM/ODM customization for chain-wide branding and provide open SDKs for POS software integration.Request Kiosk Consultation
Frequently Asked Questions
How much does a self-service kiosk cost?
A complete self-service kiosk — including touchscreen, payment terminal, receipt printer, enclosure, and installation — typically costs $2,000–$5,000 per unit. For a 4-kiosk deployment, the total upfront investment (including installation, software integration, and network) ranges from $12,800 to $34,800. Contact SynqNode for project-specific pricing.
How long does it take for kiosks to pay for themselves?
For high-volume QSR stores (200+ daily transactions), payback typically occurs in 1–3 months. For retail self-checkout, 2–6 months. For supermarkets, 3–9 months. The payback period depends on transaction volume, average ticket size, ticket lift percentage, and labor cost structure. Use the ROI calculation model above with your store's actual data.
Do kiosks really increase average order value?
Yes — consistently. Studies across QSR deployments show 15–30% ticket lift. The increase comes from systematic upsell prompts at every ordering step, visual menu presentation, and customers feeling more comfortable customizing without social pressure. The biggest gains are on modifier-heavy menus (build-your-own, bubble tea, fast casual). Retail self-checkout sees smaller lift (5–10%) — its ROI is primarily labor-driven.
Will kiosks replace my staff?
Most operators do not eliminate staff — they redeploy them. Kiosks handle the transactional portion of ordering, freeing staff to focus on food preparation, customer support, and store management. The labor cost stays roughly flat, but the value of that labor increases. Typical reduction: 20–40% of front-counter cashier hours, offset by increased floor and runner roles.
How many kiosks should I deploy per store?
It depends on your daily transaction volume. A store doing 100–200 transactions/day typically needs 2 kiosks. 200–400 transactions/day needs 3–4 kiosks. 400+ transactions/day needs 4–6 kiosks. Always keep at least one cashier-staffed lane alongside kiosks for accessibility and customer preference. Monitor kiosk utilization — if 4 kiosks are at 80%+ capacity during peak, add more.
What is the biggest mistake in kiosk deployment?
The single biggest ROI killer is not configuring upsell prompts. A kiosk with no upsell configuration shows minimal ticket lift — often under 5%. The ROI math depends on 15–30% ticket increase. Work with your POS software vendor to design the complete prompt flow: combo suggestions, add-on items, size upgrades, and dessert/beverage prompts. This is where the ROI lives.
Can I integrate kiosks with my existing POS system?
Yes — if your POS software supports kiosk integration and your kiosk hardware partner provides SDKs and drivers. Look for kiosk hardware with certified drivers for your POS software's operating system (Windows, Android, or Linux). Download SynqNode SDKs and driver packages to verify compatibility with your POS platform.
Self-Service KioskROI AnalysisRetail ChainLabor SavingsAverage Ticket LiftQSRSelf-Checkout
Looking for more retail hardware insights? Explore our Self-Service Kiosk Portfolio, Restaurant & QSR Solutions, or become a partner for OEM/ODM kiosk manufacturing support.
About SynqNode: We are a B2B retail hardware manufacturer engineering POS terminals, electronic shelf labels, self-service kiosks, industrial Mini PCs, and peripheral devices for POS software vendors, system integrators, retail chains, and distributors worldwide.